The Table view
EasyOrg provides a Table view which shows all entries, be it headers or todos, in a regular table, on per row. This table is sortable by column and it is also searchable/filterable.
The table view allows you to find all entries and sort and filter as you like to extract the necessary data from your org file.
One very useful feature of the Table view is that you can sort based on the properties assigned to different entries. This is similar to Emacs org mode's column view.
In addition to just sorting, it's also possible to perform calculations on the property values. If you have todos with properties with number values then those values can for example be added or multiplied.
Row calculations
At the top of each property's column you can select what type of operation and which columns you want to include in this operation. The result of the operation will show up in the column to the right.
For rows you can currently perform additions (Sum) and multiplications (Mult). Once you have selected an operation, you have to use the same operation for all other columns. You have to select at least two columns for the calculation, but you can select all which consists of numbers.
IMPORTANT! Number types supported are integers (100), float with dot as decimal point (5.65) and time in hours and minutes (2:30) using
:as hour/minute separator. Note that two and a half hours would be written 2:30 and not 2:50 (which is two hours and 50 minutes). Note that 2 means two minutes, not two hours.
Example 1
You could write down entries like below and then easily calculate to total to be charge (Mult) for each day and also get a summary of every day at the bottom of the rightmost blue column.
* [2022-08-25], Worked on Project A
:PROPERTIES:
:RATE: 150
:HOURS: 3:45
:DATE: [2022-08-25]
:END:
If you have many entries spanning several different months and you only want to sum up the entries for a specific month then you could filter it out using the search box, for example '2022-08' would then only show entries for August 2022 and only those entries would be used in the calculation.
TIP. Sometimes you want to only show and calculate items on the same header level in the document as they are usually of the same type. Use the level search for this. For example
l.3.
Column calculations
Each column's row can be used to calculate sums, means, min or max values of all cells in that column.
These operations are quite self explanatory, but they are:
- Sum - Add all cells in that column.
- Mean - Calculate the mean of all column values.
- Min - Find the lowest number in that column.
- Max - Find the highest number in that column.
If the first row in the column uses the time format, then all following numbers in that column will be assumed to be written in minutes, so a number of 100 would mean 100 minutes.
Example 1 (continued)
Here we see the table view and the resulting calculations we can run on the worked hours example we used above.
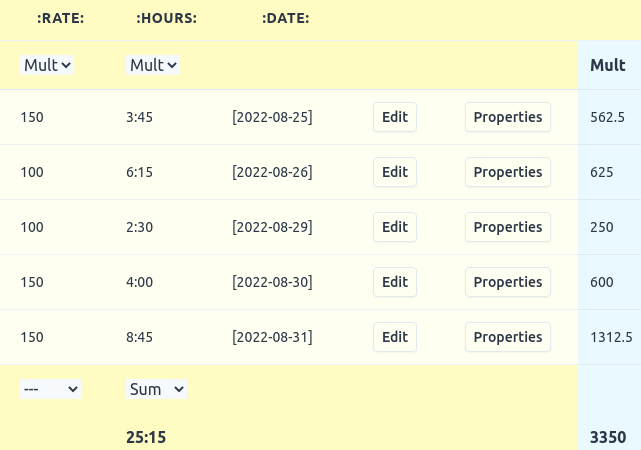
We multiply rate with the hours for each day. We also get a total sum of the amount. We can also sum the total worked hours.
This makes it easy to report to our boss or client.
Example 2
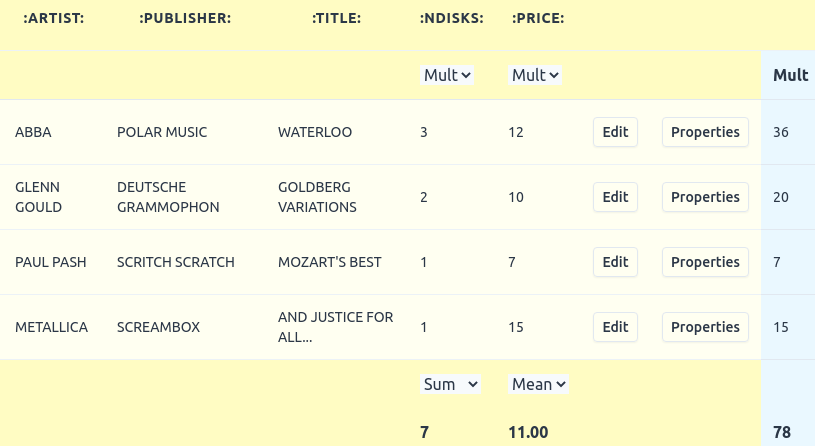
In this example we have a simple CD music library and we use our org-file as a simple database. EasyOrg's table view makes it easy to sort and filter the data.
Using the calculation functionality we can summarize some data about our collection. We multiply the number of each CD we own by its price. We can see the result to the right of each CD.
We can also summarize the total price as well as the total number of CD's. We can also calculate the mean unit price.
Search/Filter
As there can be many rows in the table it's often useful to search for the data you are looking for. EasyOrg provides many search expressions you can use specifically tailored for use with Org formatted files. One search expression which might be especially handy when in the Table view is the custom properties search. Check this page for more on searching org files.
Printing and creating PDF file
It's possible to print your Table-view content. You can print to paper or choose to save to a pdf-file.
When printing table views it's best to select landscape mode instead of portrait so that the columns can better fit.
The content that is visible will be printed with the exception of the following columns: ID, PARENT.
You find the print feature in the File menu.
Exporting to CSV
You can export the data to a CSV file for further processing if needed. The filtered rows which you can see are the ones which will be exported. The allows you to search/filter if you only want to export a subset of your data.
You find the export feature in the File menu.